Entry Price: $1.20
Exit Price: $1.15
Valid Date: From: 16/04/2024 To: 30/04/2024
Investing is the best way to secure your future. In this world there are two ways to earn income; one is to exchange your labor for dollars and the other is to have your money earn money for you. The rich know this and the poor don’t. It’s as simple as that.
To buy units in FHUT the investor/s must first read the FHUT Prospectus then complete the application form at the back of this Prospectus. A receipt will be issued to the unit holder upon receipt of funds. FHUT units can be purchased from our head office.
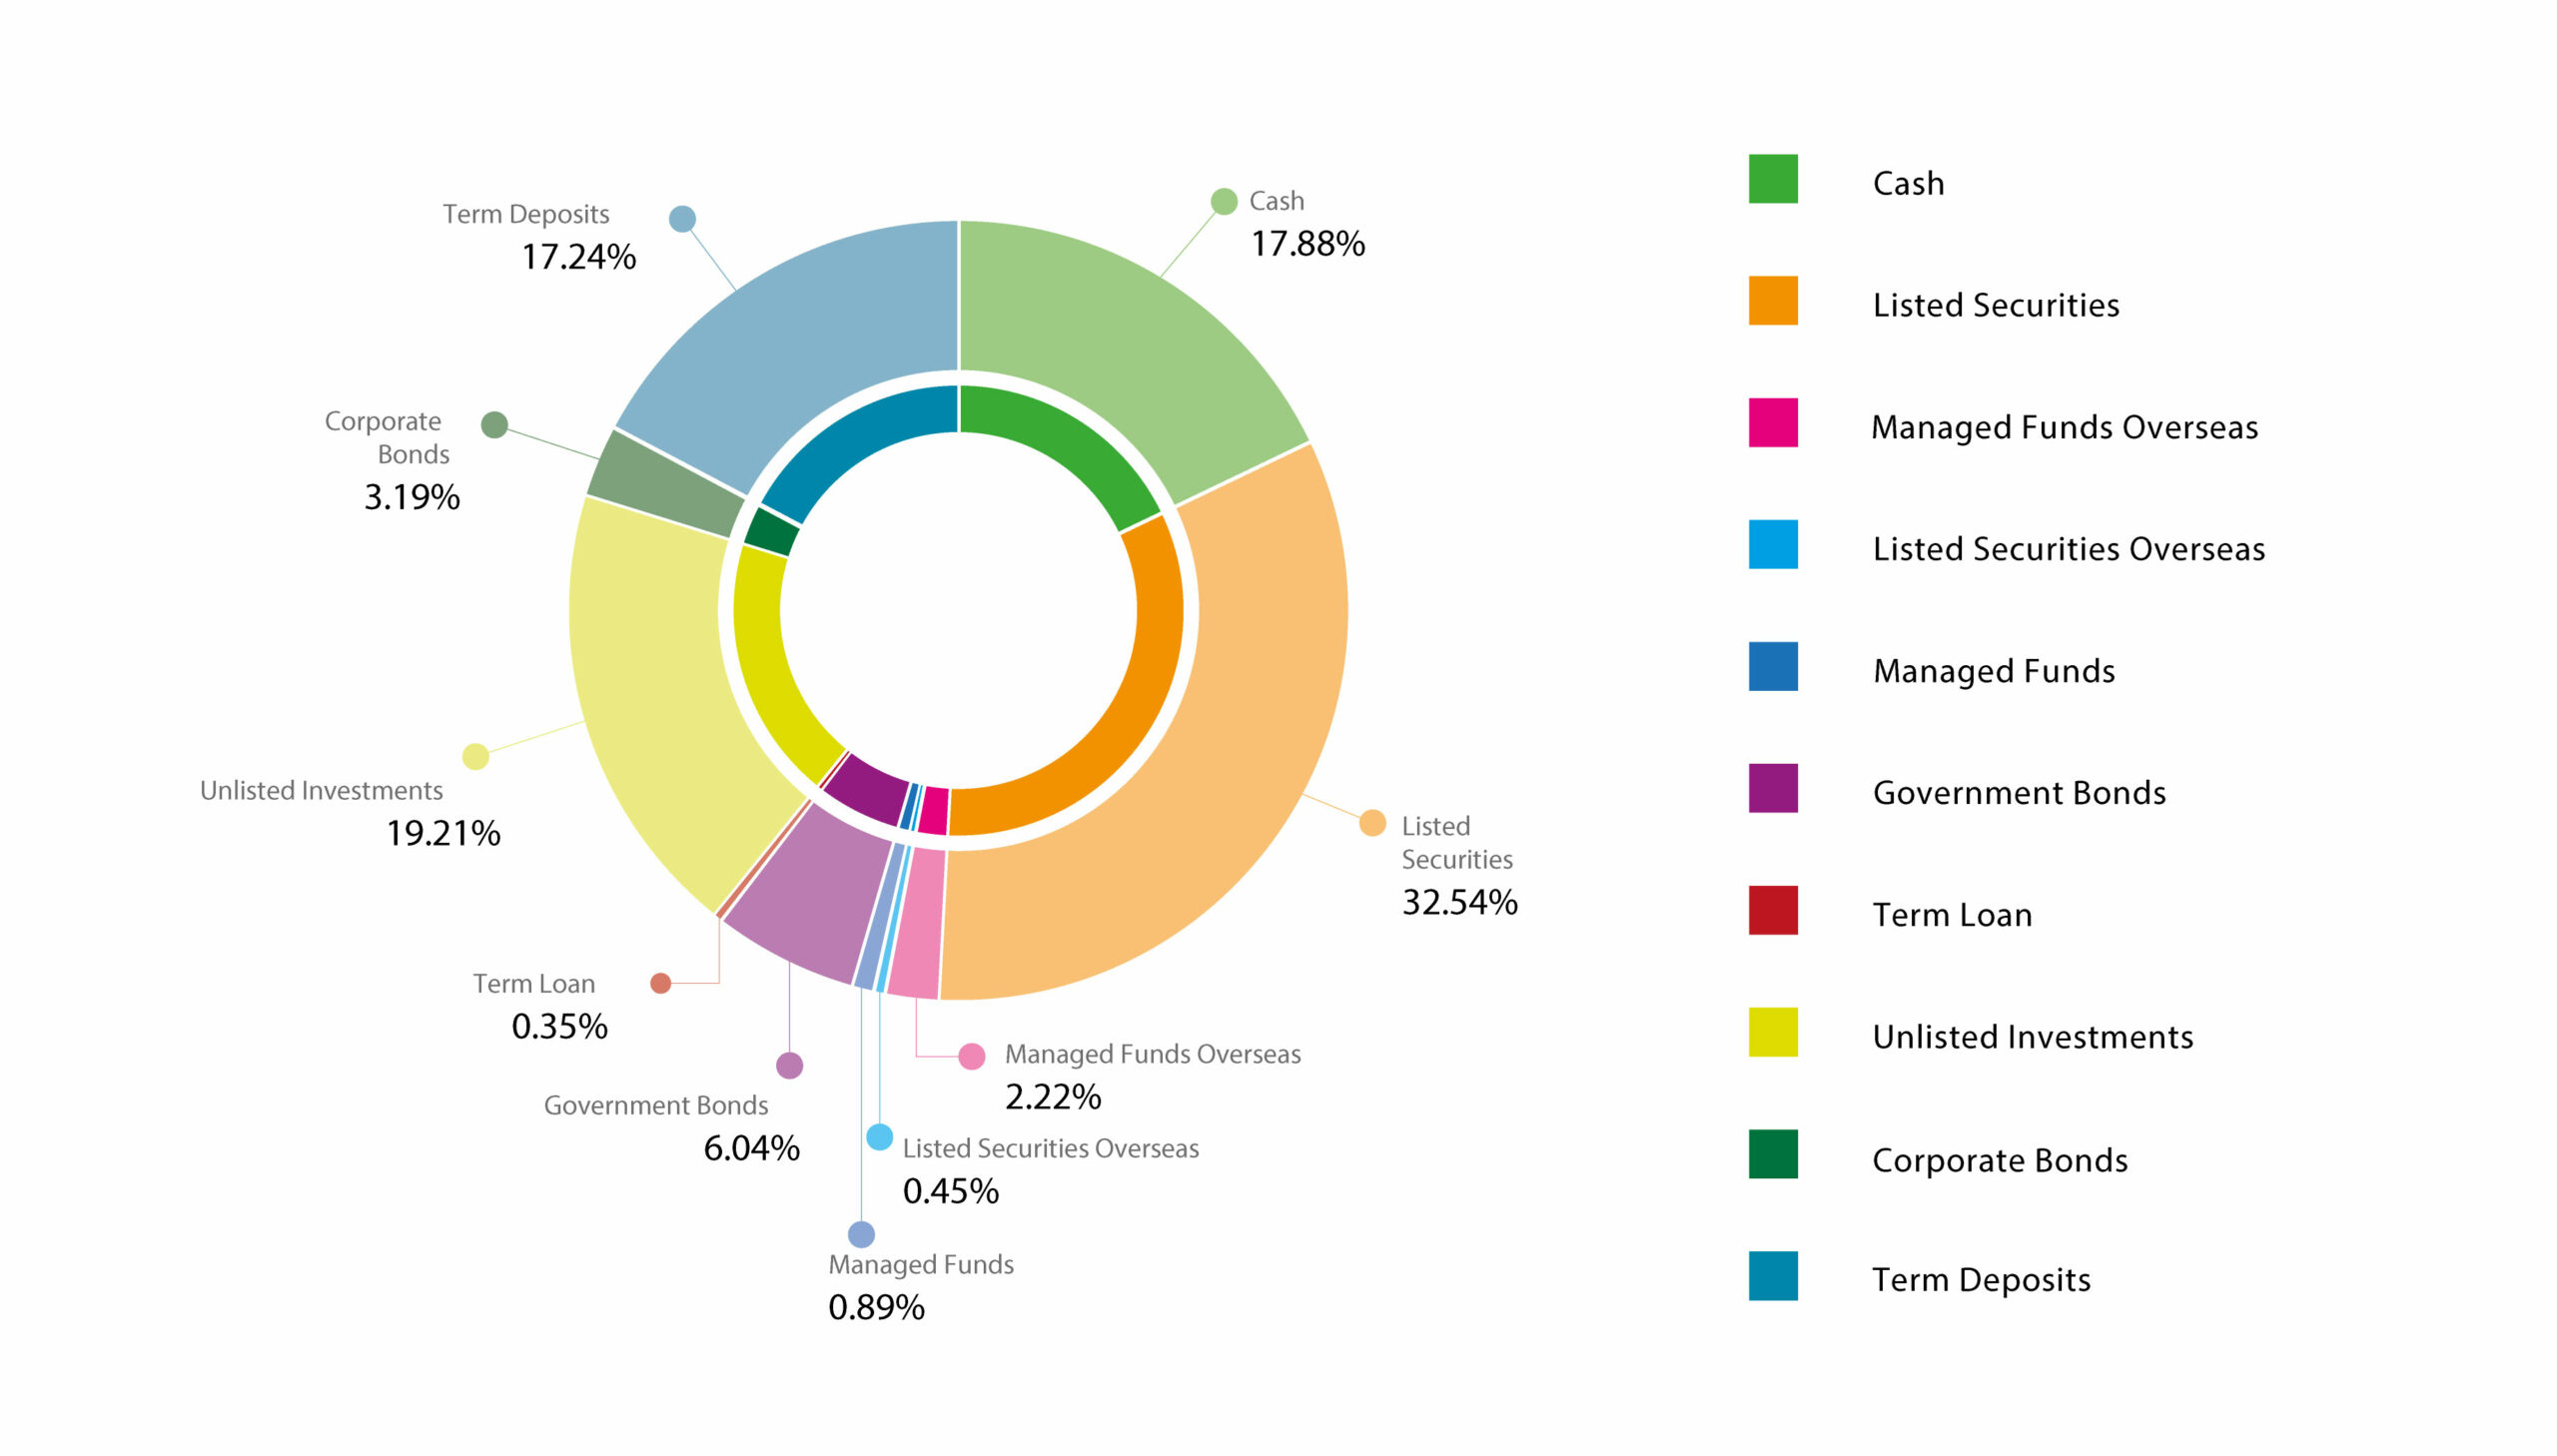
Investment Portfolio
Diversify your investment portfolio with the Fijian Holdings Unit Trust—a strategic opportunity to engage in Fiji’s economic growth. By participating in the Fijian Holdings Unit Trust, you align your investment strategy with the stability and potential of Fiji’s diverse business landscape.


Mr. Vignesh from Vunivau, Labasa. -

Mr. Waisea from Koroinasolo, Bua, Bua. - Trustees of Koroinasolo Vill Account

Mr. Josaia Radrodro from Baleyaganiga vill, Vaturova, Cakaudrove - Trustee of Mataqali Nabukarabe Investment account

Fijian Holdings Unit Trust is a diversified income and growth managed investment scheme, regulated by the RBF. FHUT funds are pooled and invested by the Fund Manager, FHL FML, to enable Unit holders’ investments to grow in value and earn income over time.
The initial minimum investment is 50 units (10 units for Employee Deduction Scheme). The total cost of this investment will be calculated by multiplying the current entry price1 with the initial minimum units. e.g., 50 units x $0.98 = $49.00.
There is no defined minimum investment period however unit trusts are considered medium to long term investment products. This means that it is recommended that you leave your investment in the fund for a minimum of 5 years. Please note that you may incur capital loss on your investment if you redeem your units before the recommended period.
There is no minimum balance for units to be held with FHUT, however, to qualify for dividends in FHUT, 50 units must be maintained by Unit holders at dividend cut-off date on 31st October, 28th (29th) February and 30th June annually.
FHUT’s dividend distribution policy is to pay dividends to its Unit holders that hold 50 units or more, three times a year on 21st of every payout month, November, March and July each year.
Request a Call Back
“Please fill out the form, and our representatives will get back to you shortly. Thank you for your inquiry!”


